View Range-based Data
Example Overview
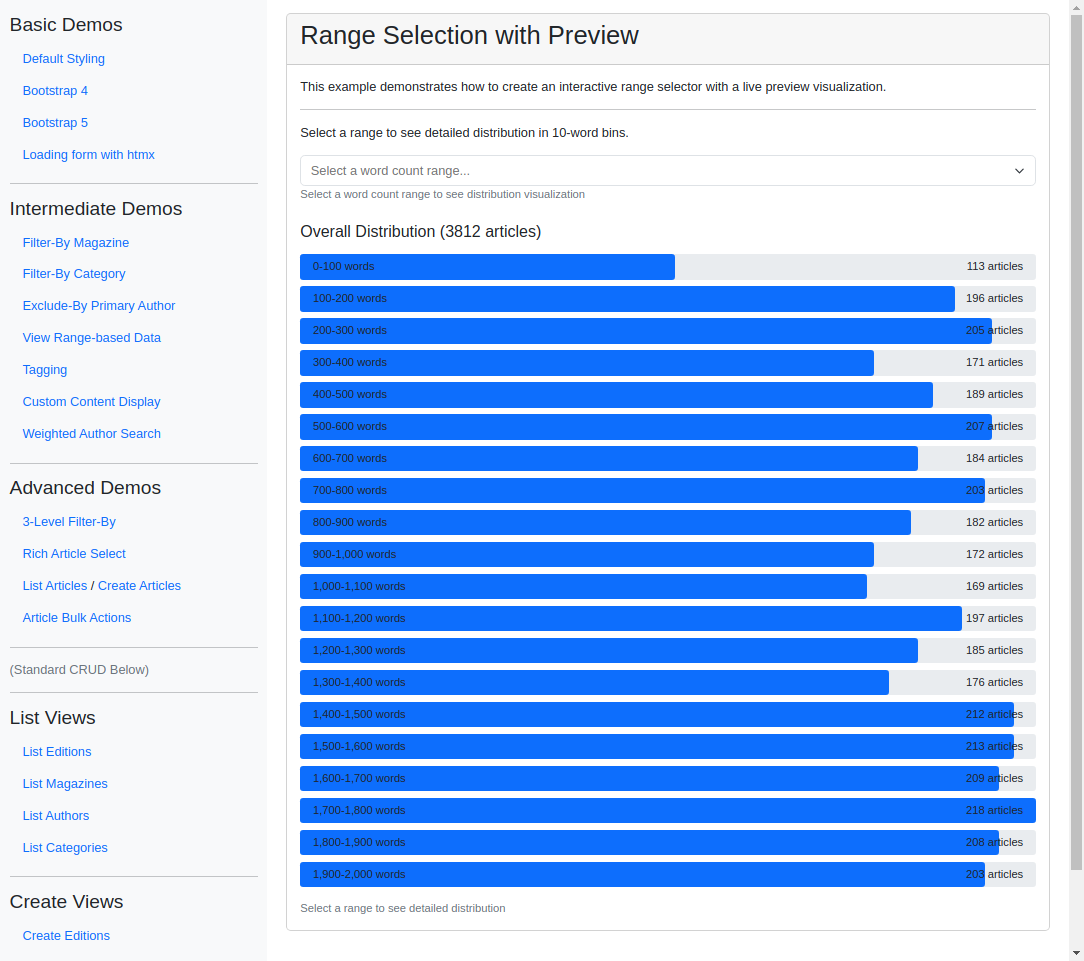
This example pairs a TomSelectChoiceField range selector with an HTMX-driven live preview: selecting a word-count range instantly redraws a bar chart of how many articles fall in each sub-bin (the selected range is broken into 10-word bins), all without a page reload. Use this pattern for interactive filtering and visualization - analytics dashboards, price or date-range filters, or any UI where users explore data distributions by selecting a range.
Visual Examples
Key Code Segments
Forms
The form uses TomSelectChoiceField to allow users to select a range dynamically.
Form Definition
class RangePreviewForm(forms.Form):
    """Form demonstrating dynamic range selection with live preview."""

    word_count = TomSelectChoiceField(
        config=TomSelectConfig(
            url="autocomplete-page-count-range",
            value_field="value",
            label_field="label",
            css_framework="bootstrap5",
            placeholder="Select a word count range...",
            preload="focus",
            highlight=True,
            minimum_query_length=0,
        ),
        help_text="Select a word count range to see distribution visualization",
    )
Explanation:
The
word_countfield is configured with aTomSelectConfigobject that connects to an autocomplete endpoint and allows range selection.The
highlightparameter ensures the selected range is visually prominent.
Templates
The form is rendered in the range_preview.html template, where HTMX is used to update the preview dynamically based on the selected range.
Template Code
{% extends 'example/base_with_bootstrap5.html' %}

{% block extra_header %}
    {{ form.media }}
    <style>
        .preview-container {
            min-height: 300px;
        }
        .bar-container {
            height: 2rem;
            background-color: #e9ecef;
            margin-bottom: 0.5rem;
            border-radius: 0.25rem;
            position: relative;
            overflow: visible;
            display: flex;
            align-items: center;
            padding: 0 1rem;
        }
        .bar {
            height: 100%;
            background-color: #0d6efd;
            transition: width 0.3s ease;
            position: absolute;
            top: 0;
            left: 0;
            border-radius: 0.25rem;
        }
        .bar.selected {
            background-color: #0a58ca;
        }
        .bar-label {
            position: relative;
            flex-shrink: 0;
            color: #212529;
            font-size: 0.875rem;
            white-space: nowrap;
            z-index: 1;
        }
        .bar-value {
            position: relative;
            margin-left: auto;
            color: #212529;
            font-size: 0.875rem;
            white-space: nowrap;
            z-index: 1;
        }
        .helptext {
            font-size: 0.875rem;
            color: #6c757d;
        }
    </style>
{% endblock %}

{% block content %}
    <div class="card">
        <div class="card-header">
            <h2>Range Selection with Preview</h2>
        </div>
        <div class="card-body">
            <div class="pb-3">
                This example demonstrates how to create an interactive range selector with a live preview
                visualization.
                <hr>

                Select a range to see detailed distribution in 10-word bins.
            </div>

            <form>
                {% csrf_token %}
                <div class="mb-4">
                    {{ form.word_count }}
                    {% if form.word_count.help_text %}
                        <div class="helptext">{{ form.word_count.help_text }}</div>
                    {% endif %}
                </div>
            </form>

            <div class="preview-container mt-4"
                 id="preview-container"
                 hx-get="{% url 'update-range-preview' %}"
                 hx-trigger="change from:#id_word_count"
                 hx-target="#preview-container"
                 hx-include="#id_word_count"
                 hx-swap="innerHTML">
                 {% comment %} {% include "example/intermediate_demos/range_preview_bars.html" %} {% endcomment %}
            </div>
            <div hx-get="{% url 'update-range-preview' %}"
                 hx-trigger="load"
                 hx-target="#preview-container"
                 hx-swap="innerHTML">
            </div>
        </div>
    </div>
{% endblock %}
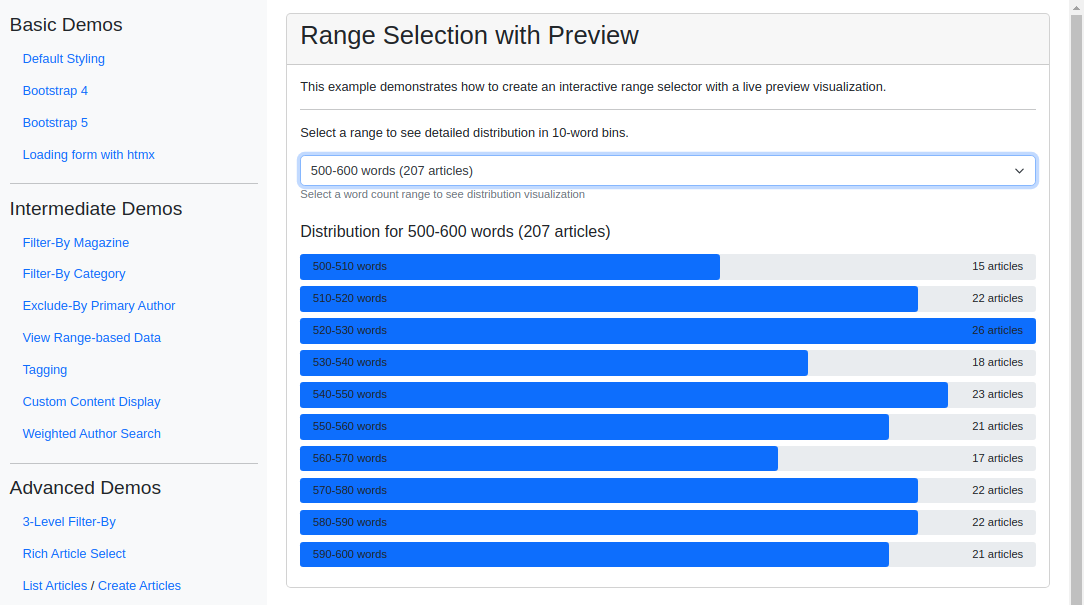
We load the preview container with the initial data on page load and update it when the selected range changes. The range_preview_bars.html template is included in the preview container to display the data visualization.
Data Visualization Template
{% load chart_tags %}

<div class="mb-3">
    {% if is_detail_view %}
        <h5>Distribution for {{ selected_range }} words ({{ total_articles }} articles)</h5>
    {% else %}
        <h5>Overall Distribution ({{ total_articles }} articles)</h5>
    {% endif %}
</div>

{% for item in data %}
    <div class="position-relative bar-container">
        <div class="bar {% if item.range == selected_range %}selected{% endif %}"
             style="width: {{ item.count|percentage_of_max:max_count }}%">
        </div>
        <span class="bar-label">{{ item.range }} words</span>
        <span class="bar-value">{{ item.count }} article{{ item.count|pluralize }}</span>
    </div>
{% endfor %}

{% if not is_detail_view %}
    <div class="text-muted small mt-3">
        Select a range to see detailed distribution
    </div>
{% endif %}
HTMX Endpoint for Preview Updates
The update-range-preview endpoint processes the selected range and returns the updated data visualization. It uses the get_detailed_range_statistics function to calculate the distribution within the selected range. If no range is selected, it displays the overall distribution.
The get_range_statistics function calculates the distribution for predefined range bins. The range_preview_demo view renders the initial form, and update_range_preview updates the visualization based on the selected range.
Endpoint Code
def get_range_statistics():
    """Get article counts for each word count range."""
    stats = []

    for start, end in word_count_range:
        # Create range filter
        range_filter = Q(word_count__gte=start) & Q(word_count__lt=end)
        count = Article.objects.filter(range_filter).count()

        stats.append({"range": f"{start:,}-{end:,}", "count": count, "range_tuple": (start, end)})

    return stats


def get_detailed_range_statistics(start, end, bin_size=10):
    """Get detailed article counts within a range, binned by specified size."""
    stats = []

    # Create bins for the range
    for bin_start in range(start, end, bin_size):
        bin_end = min(bin_start + bin_size, end)

        # Create range filter for this bin
        range_filter = Q(word_count__gte=bin_start) & Q(word_count__lt=bin_end)
        count = Article.objects.filter(range_filter).count()

        stats.append(
            {
                "range": f"{bin_start:,}-{bin_end:,}",
                "count": count,
                "bin_start": bin_start,
                "bin_end": bin_end,
            }
        )

    return stats


def range_preview_demo(request):
    """View demonstrating range selection with preview.

    Provides the form and loads update_range_preview via HTMX.
    """
    template = "example/intermediate_demos/range_preview.html"
    context = {}

    context["form"] = RangePreviewForm()
    return TemplateResponse(request, template, context)


def update_range_preview(request):
    """HTMX endpoint for updating the visualization."""
    template = "example/intermediate_demos/range_preview_bars.html"
    context = {}

    selected_value = request.GET.get("word_count")

    if selected_value:
        try:
            # Parse the selected range from "(start, end)" format
            selected_value = selected_value.strip("()")
            start, end = map(int, selected_value.split(","))

            # Get detailed statistics for the selected range
            stats = get_detailed_range_statistics(start, end)
            range_label = f"{start:,}-{end:,}"
            is_detail_view = True
            total_articles = sum(item["count"] for item in stats)
        except (ValueError, TypeError) as e:
            logger.warning("Error parsing range: %s", e)
            stats = get_range_statistics()
            range_label = None
            is_detail_view = False
            total_articles = sum(item["count"] for item in stats)
    else:
        # Show overall statistics if no range selected
        stats = get_range_statistics()
        range_label = None
        is_detail_view = False
        total_articles = sum(item["count"] for item in stats)

    max_count = max((item["count"] for item in stats), default=0)

    context["data"] = stats
    context["selected_range"] = range_label
    context["max_count"] = max_count
    context["is_detail_view"] = is_detail_view
    context["total_articles"] = total_articles
    return TemplateResponse(request, template, context)
Autocomplete Views
The autocomplete-page-count-range endpoint serves the dropdown options for word count ranges.
The WordCountRangeAutocompleteView class extends AutocompleteIterablesView to provide labeled options with counts for each range. It fetches the statistics using the get_range_statistics function, overriding the get_iterable method to return the formatted range options.
Autocomplete View
class WordCountRangeAutocompleteView(AutocompleteIterablesView):
    """Autocomplete view for the word count ranges with actual statistics."""

    iterable = word_count_range
    page_size = 10

    def get_iterable(self):
        """Convert the word count range tuples into labeled options with counts."""
        stats = get_range_statistics()
        ranges = []

        for stat in stats:
            start, end = stat["range_tuple"]
            label = f"{stat['range']} words ({stat['count']} articles)"
            value = f"({start}, {end})"  # Tuple string representation
            ranges.append({"value": value, "label": label})
        return ranges
Implementation Notes
The autocomplete view’s
get_iterableoverride turns each range tuple into a labeled option carrying its live article count, so the dropdown labels stay in sync with the data.get_detailed_range_statisticsbins the selected range into fixed-size sub-ranges (default 10 words) to drive the detailed preview; with no range selected,get_range_statisticsreturns the overall per-range distribution instead.